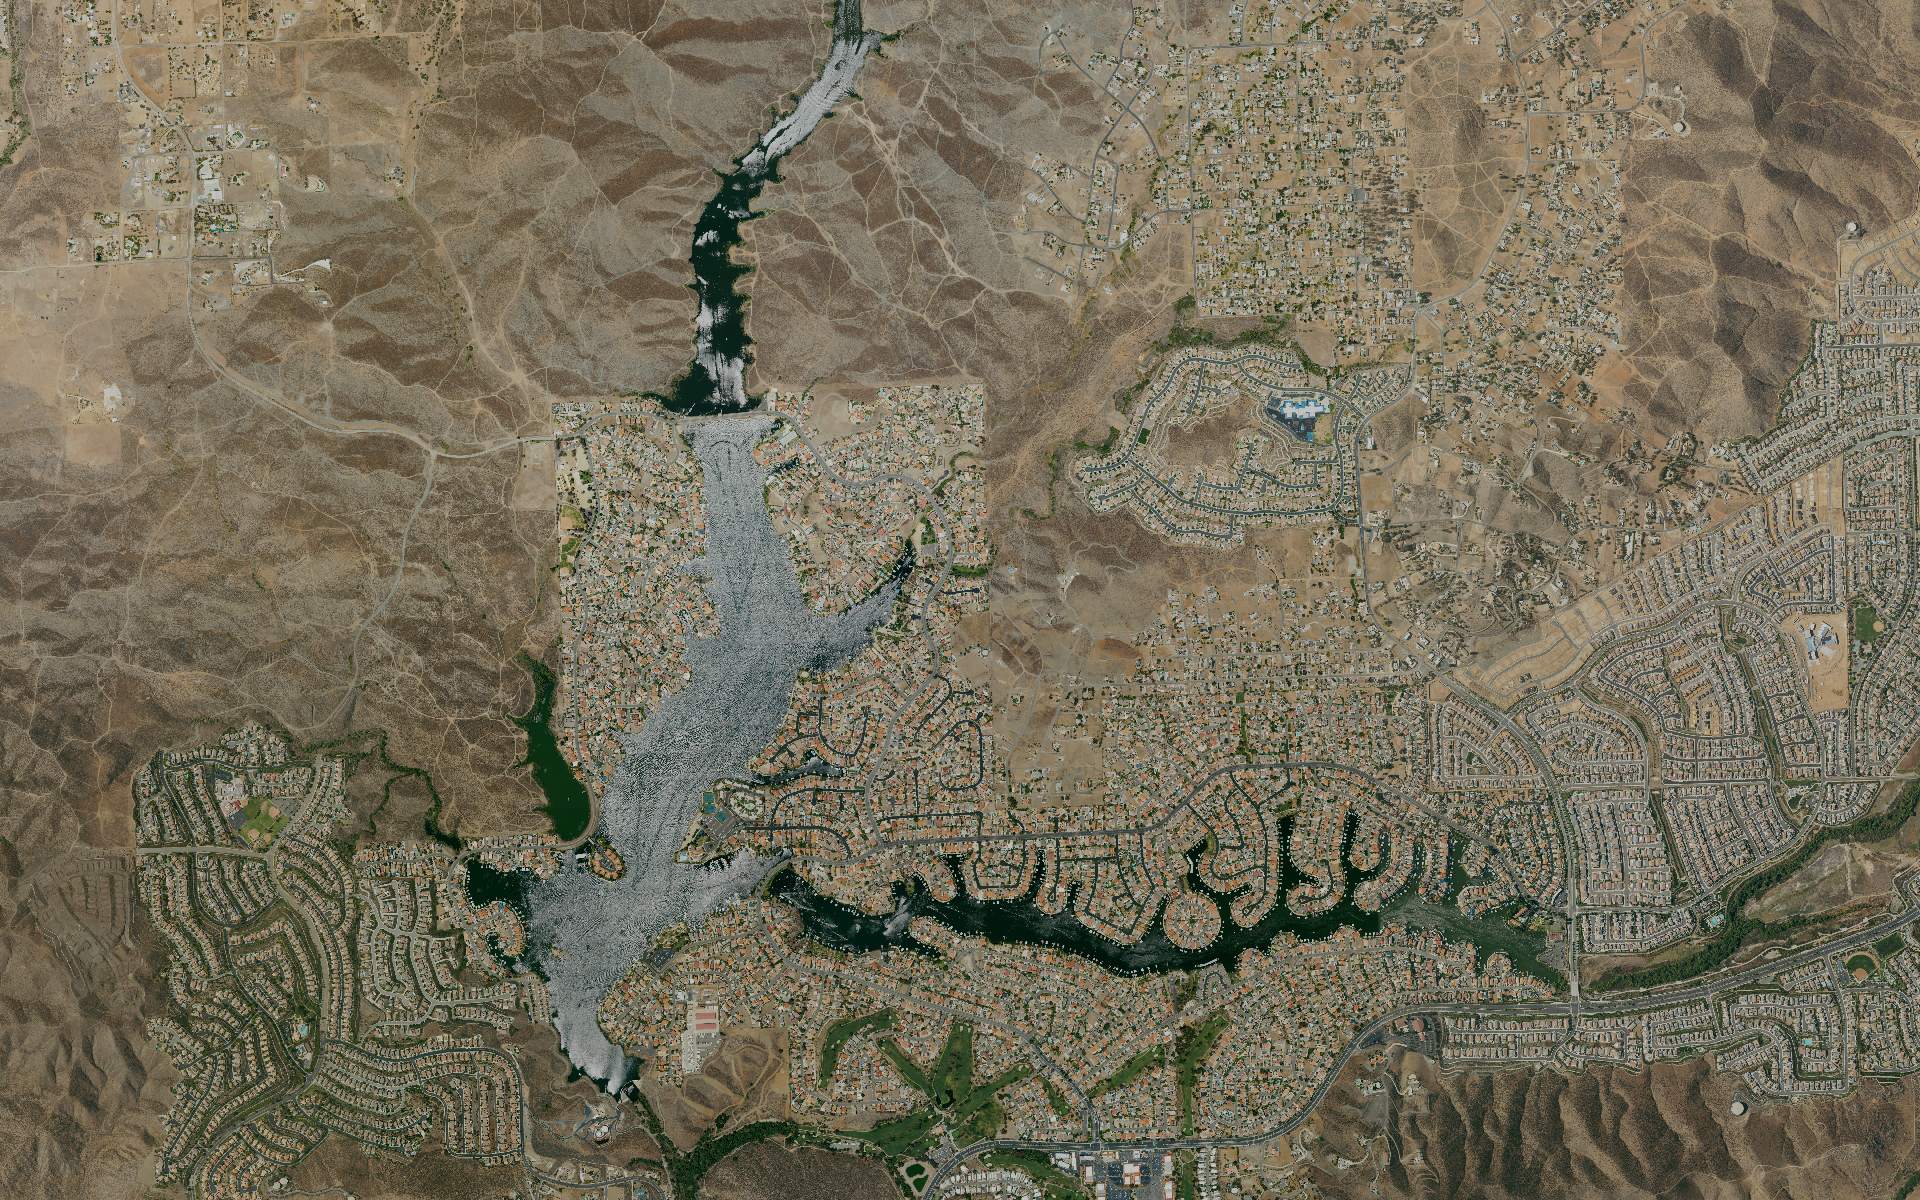
3DEP LIDAR · QL2 · 2019–2024
SENTINEL-2 NDII · 14 DAY
EPSG:3310 · CA ALBERS
FIRE FUEL · MAPPED · REFRESHED EVERY 14 DAYS
Wildfire risk you can measure.
We map the high-risk areas on your land — the dry trees and brush most likely to carry fire — and re-model the risk every two weeks as moisture changes. So a drying canyon shows up while there's still time to cut, clear, and treat.
01 — THE ONE THING YOU CAN CHANGE
Fire behavior runs on three things: weather, terrain, and fuel.
You can't change the weather. You can't move the terrain.
Fuel is the one you can manage. We don't just rank risk — we show you where it is, and where to mitigate it, acre by acre.
In the climate we have now, vegetation management is what keeps land sustainable for the long term. It starts with knowing where to act.
02 — FROM MAP TO ACTION
Find the fuel. Reduce the fuel.
Prove it.
Know where the fuel is
A map of the high-risk areas on your landscape — the actual fuel sources, located and dated. Not a hazard color for the whole county; a specific place you can send a crew.
→ high-risk areas, per hexKnow where to start cutting
High-risk areas ranked by severity and by what they threaten — so limited treatment dollars go to the acres where removing fuel buys the most risk reduction.
→ a treatment plan, not a mapKnow it's still true
The risk model updates on a two-week cadence, tracking moisture content as it changes — a treated unit shows its risk gone, and a drying one flags before fire season does.
→ measure · treat · re-measureEVERY HEX SHIPS WITH ITS MEASUREMENT DATE AND FIELD-VALIDATION METHOD, AND IS RE-MODELED EVERY 14 DAYS AS MOISTURE CHANGES. FRESH, NOT ARCHIVAL.
03 — WHO IT'S FOR
For everyone who answers for land.
Ranchers & landowners
Know what's standing on your ground — the pasture edges, the wood lot, the canyon behind the barn — and which acres are worth clearing first.
HOAs & communities
Common-area fuel, mapped and documented — for the board, the residents, and the insurer asking questions.
Fire districts & councils
The evidence layer for your CWPP and your next grant application: high-risk areas mapped by treatment unit, ready for a board meeting.
Cities & counties
Rank neighborhoods, parks, and open space by mapped fuel risk — and defend the mitigation budget in public, with evidence.
State & federal agencies
Landscape-scale fuel mapping that stays consistent across jurisdictions and across years — one method, comparable everywhere.
Utilities
A WMP-grade fuels input, in and beyond the right-of-way — defensible, audit-ready, and built to feed your risk-spend-efficiency math.
Insurers & lenders
A dated, explainable risk map refreshed every two weeks — supporting mitigation credits, score disclosure, and appeals.
Land trusts & timber
Stewardship monitoring and before/after treatment proof — for easements, harvest plans, and the funders behind them.
Own it, manage it, insure it, or answer for it — if you have a stake in the land, you can measure it.
04 — GET A REPORT
Less fuel, less risk.
We show you where.
Send us your area of interest — a district, a corridor, a county. We'll show you where the high-risk areas are, how recently each was measured, and where removal pays off most.
or write to kevin@adv-algos.com